Introduction/Summary
Returns account for 24.5% of U.S. online sales—a figure that climbed steadily through 2024 and shows no sign of slowing down. For most e-commerce business operators, that number represents lost margin, wasted labor, and frustrated customers. But it doesn't have to. This ecommerce returns management guide breaks down benchmarks, true costs, step-by-step processes, and the strategic decisions that separate brands bleeding money from those turning returns into a competitive advantage.
The Growing Importance of Returns Management in eCommerce
Managing returns effectively is no longer just an operational necessity; it’s a critical growth lever. With return rates three to four times higher online than in physical stores, returns touch every aspect of your business—from customer retention to inventory management and profitability.
How We Approach Returns Management at Scale
Most brands treat returns as a cost center—something to minimize, outsource, and forget about. That framing misses the point. Returns management focuses on converting a necessary operational reality into a growth lever for customer loyalty, product improvement, and repeat purchases.
Key Performance Indicators That Matter for Returns Profitability
- Return rate by order and by item – what percentage of orders generate returns
- Time-to-refund or time-to-exchange – speed directly influences customer satisfaction
- Recovery rate – proportion of returned merchandise that returns to full-price inventory
- Cost-per-return – shipping, labor, restocking, disposal, and customer service combined
- Retention rate for returners – do customers who return come back and buy again?
The balance between customer experience and margin protection is where most brands struggle. Generous policies increase conversions and trust but raise cost and abuse risk. Restrictive policies protect margins but risk cart abandonment and negative reviews.
ShipNetwork’s Differentiated Approach to Returns
At ShipNetwork, our approach differs from traditional 3PL returns handling. Our distributed warehouse footprint—reaching 98% of the U.S. population within 1–2 days via ground—means reverse shipments route to the nearest fulfillment center, cutting transit time and cost. Our 100% order accuracy guarantee reduces returns caused by wrong items shipped. And our API integrations provide real-time visibility into every stage of the returns process, tying returns back to original fulfillment data for faster disposition decisions.
Why Returns Management Is a Growth Issue, Not Just Operations
Returns are 3–4 times higher for online products than in-store purchases. That gap isn't shrinking. And every return touches customer lifetime value, repeat purchase rates, and brand reputation.
The Impact of Returns on Customer Loyalty
The data is clear: 91% of customers say ease of returns affects their willingness to shop with a brand again. Brands that implement automated, frictionless ecommerce returns management see measurable results. One activewear brand reported a 44-point increase in post-return repurchase rate after streamlining their returns process. Chubbies, the menswear brand, saw their LTV increase by 100% after optimizing returns through automated portals—generating roughly $200,000 in incremental annual revenue from upsells during the return flow.
Returns Management Protects Your Customer Acquisition Investment
Poor returns management destroys acquisition investments. You spend $30–$80 acquiring a customer through paid media. If their return experience is painful enough that they never come back, that acquisition cost is gone. Inaccurate product details lead to customer returns. Poor quality products are the second most common return reason. Both are fixable—if you're using return data to inform product development and inventory optimization.
Using Returns Data to Reduce Future Returns
Brands that analyze returns data at the SKU level—isolating sizing mismatches, photography issues, recurring defects—have reduced return rates by 10–25% within two quarters by fixing root causes. Returns data is a product development goldmine. Treat it that way, and you build customer loyalty that compounds over time.
c
Return Rate Benchmarks by Industry
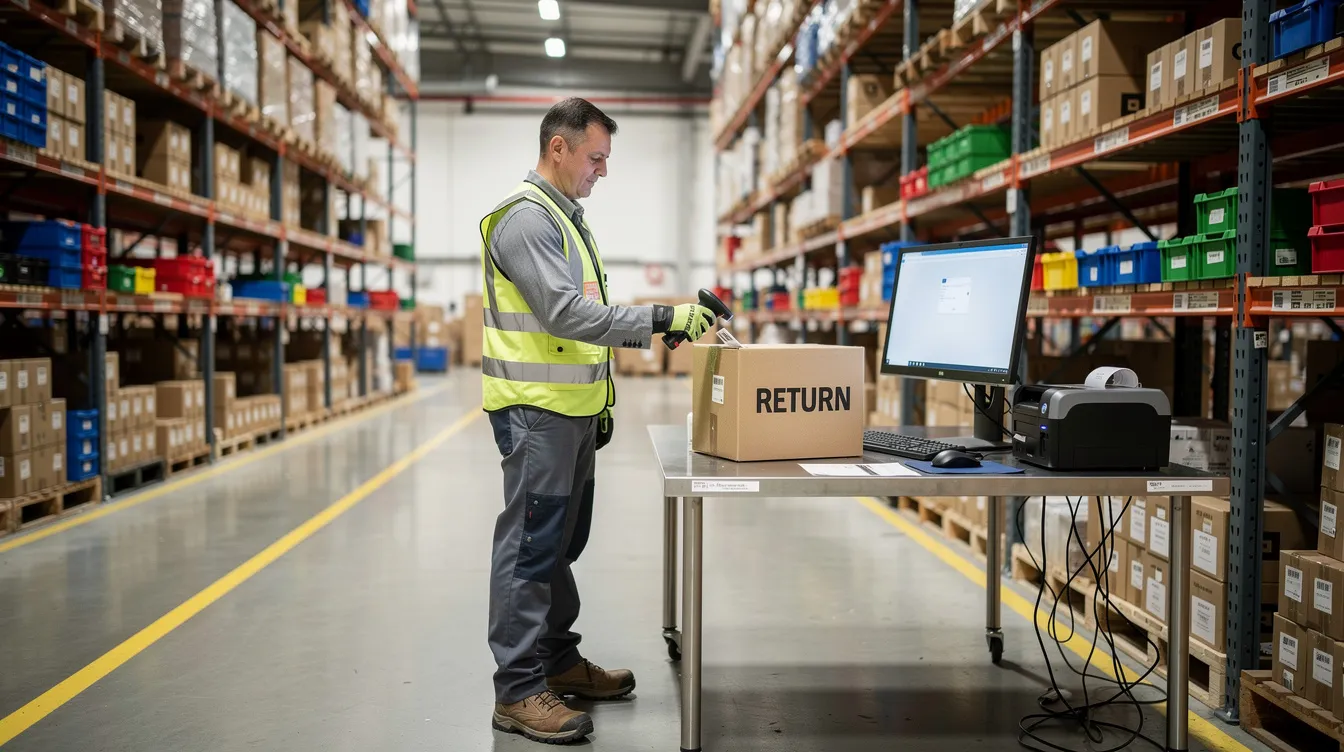
Understanding your average ecommerce return rate starts with knowing where your vertical sits. E-commerce return rates are around 30% overall, much higher than 9% for in-store purchases. But the range varies dramatically by category.
Clothing has an 88% return rate among online shoppers when you factor in bracketing—the practice where customers order multiple sizes with the intent to return most of them. That number sounds extreme, but it reflects the reality of categories where fit uncertainty drives purchasing behavior.
When benchmarking, compare your product vertical, average order value, shipping distance, and product fragility. Seasonal spikes—especially post-holiday—inflate return rates significantly. Use rolling averages over 90-day windows for a clearer picture.
The National Retail Federation puts the overall online return rate at roughly 19.3% of sales in 2025, with total returned merchandise reaching $849.9 billion across all channels.
The True Cost of Returns: Beyond the Refund
A refund is just the beginning. Returns can cost retailers up to 30% of the product's value when you account for the full cost stack. A single return can wipe out the entire margin on a $60 order.
Breakdown of Return Costs
Here's where the money actually goes:
- Reverse shipping and carrier fees: Return label costs typically run $5–$15 depending on weight and distance. For large items, freight costs can reach hundreds of dollars per unit.
- Inspection and processing labor: Receiving, unpacking, condition assessment, cleaning, testing (for electronics), and grading. Average labor costs run $4–$12 per return.
- Repackaging and restocking: Replacing inserts, cleaning packaging, minor repairs. This can represent 20–30% of per-return cost in some categories.
- Write-off risk: Fewer than half of returned items are resold at full price. Items that are opened, used, or hygiene-compromised often go straight to disposal.
- Hidden costs: Customer service time consumed by returns (up to 60–70% of CS team capacity in brands with manual workflows), system overhead, and lost sales opportunities from cash tied up in returned inventory.
Returns Fraud: A Costly Challenge
Returns fraud cost U.S. retailers nearly $25.3 billion in 2020, adding another layer of financial risk to brands without proper verification systems.
The Returns Management Process Step by Step
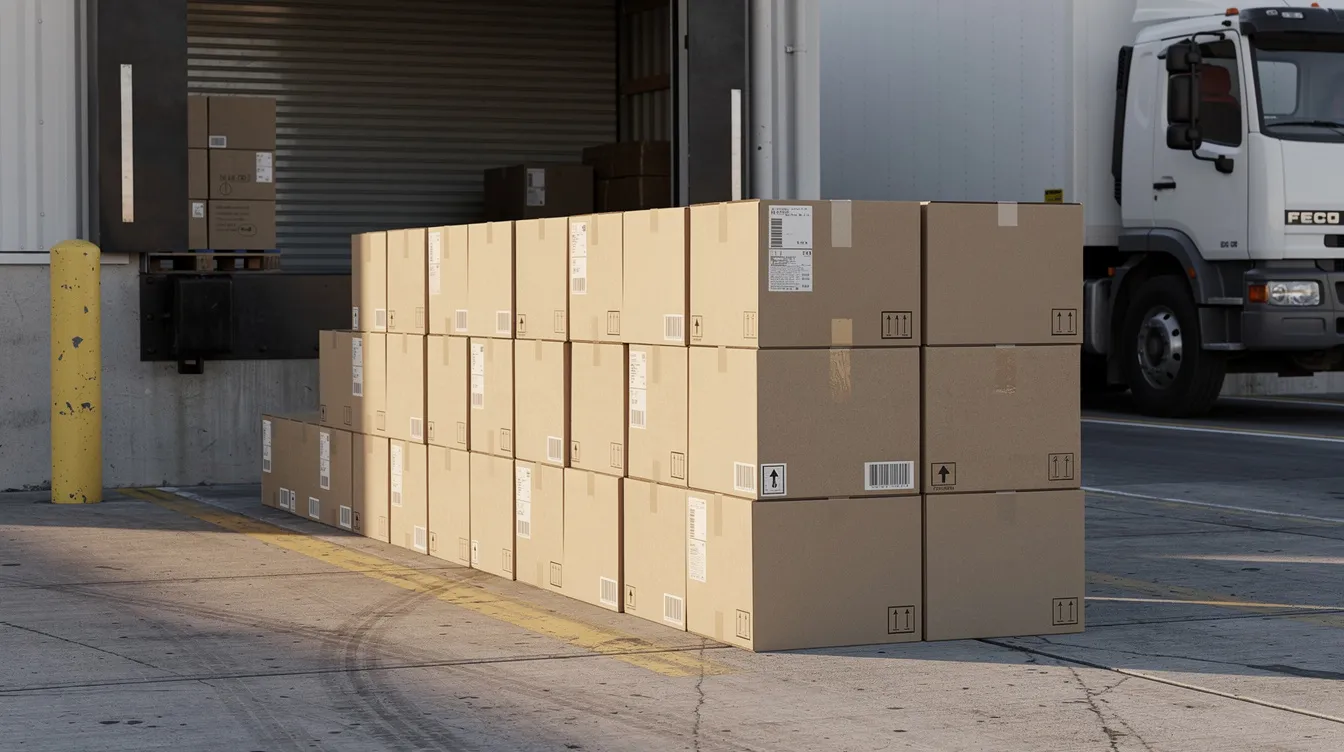
Effective return management involves tracking from initiation to final disposition. Here's the entire process broken into its core phases.
Customer Return Initiation
The returns management process starts the moment a customer decides to send something back. An intuitive returns portal—where customers can initiate return requests, select refund or exchange, and generate a return shipping label—is no longer optional; it's expected. Providing user-friendly return portals can enhance the customer experience and reduce support volume. Self-service portals eliminate 60–80% of inbound CS contacts related to returns.
Return eligibility verification should happen automatically. Does the item fall within the return window? Is it an eligible category? Does the condition meet policy requirements? Automated RMA approvals speed up the returns process significantly compared to manual email-based workflows.
Communication templates matter. Set clear expectations about timeline, refund status, and how product condition affects the appropriate refund amount. 84% of customers read return policies before making purchases. Integration with ecommerce platforms—Shopify, WooCommerce, Amazon—ensures return data syncs to your order management system in real time.
Carrier Pickup and Reverse Shipping
Return label generation and carrier selection should be optimized for cost and speed. Returns management software automates label generation and approvals, routing packages through the most efficient carrier based on weight, origin, and destination. 30% of consumers prefer return labels included in shipments, though digital label generation is increasingly standard.
Real-time tracking keeps customers informed about their returns. This transparency reduces "where's my refund?" inquiries and builds trust throughout the customer journey. For international returns, customs forms, duties, and VAT considerations add complexity. Many brands limit return eligibility for cross-border orders or require the customer to cover return shipping costs.
Consolidation strategies—combining multiple return items from the same customer or geographic area—reduce per-unit shipping costs.
Receiving and Initial Inspection
Dedicated processing zones in the warehouse separate customer returns from fresh inbound stock. This prevents contamination of sellable inventory and speeds processing.
Initial condition assessment includes documenting damage, verifying SKU accuracy, and photographing items for quality control and return fraud prevention. Streamlining the return inspection process is crucial for efficiency—every hour an item sits unprocessed is margin lost.
Inventory management system updates happen immediately: flag the item as unavailable until disposition is decided. Tracking accuracy at this stage prevents phantom inventory from appearing as sellable.
Detailed Inspection and Disposition Decision
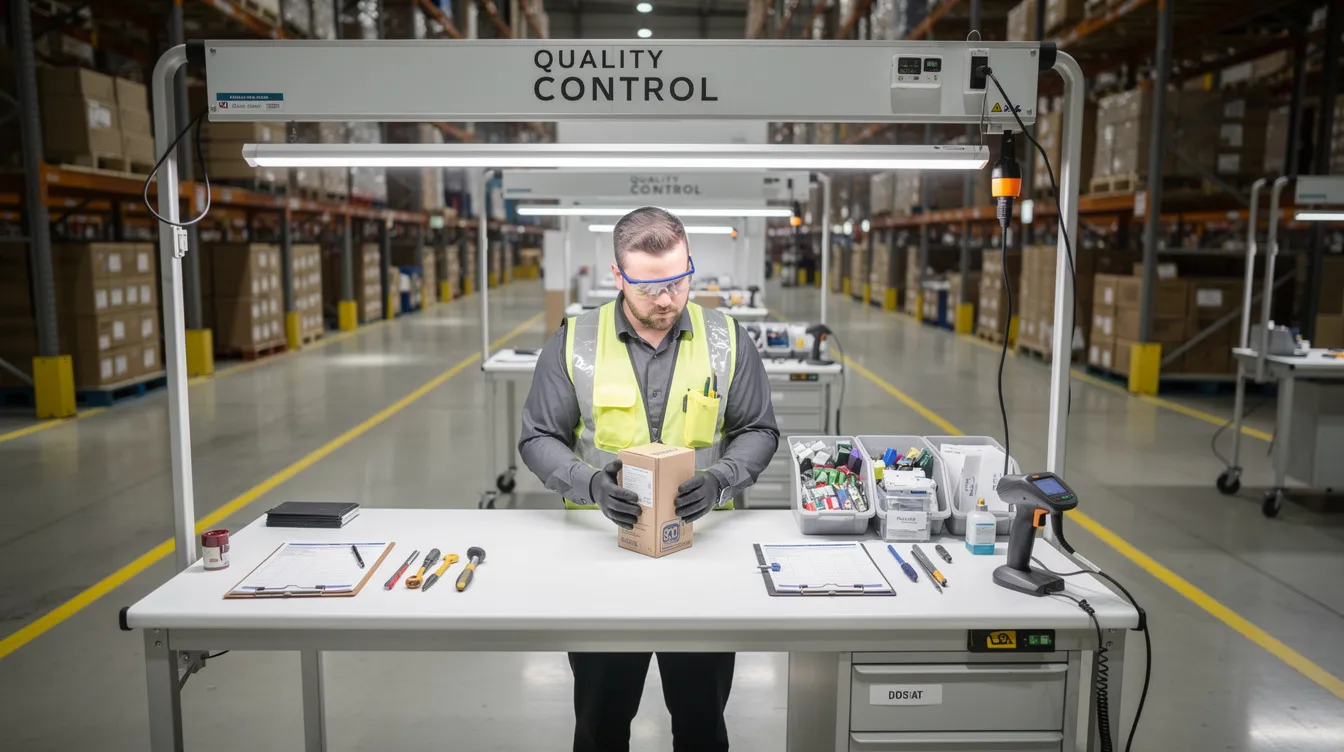
Quality control standards define what qualifies as "sellable as new," "refurbishable," "liquidatable," or "destroy." Build a decision tree: if refurbishment cost exceeds 50% of product price, route to liquidation or write-off.
Documentation requirements include SKU-level metadata—return reason, condition rating, images. This feeds analytics that help you identify trends and reduce future returns. Real-time inventory updates through your warehouse management system integration ensure items re-enter the sellable pool only when truly ready.
The Four Return Dispositions and Margin Impact
Every returned item follows one of four paths. Each has different margin implications.
Return to Sellable Inventory
Items that are unused, tags intact, packaging undamaged, and functionally perfect go back to full-price stock. Repackaging and quality restoration—replacing inserts, cleaning outer packaging—adds cost but recovers full margin minus processing expense.
Prioritize quick re-listing. Allocate restored inventory to warehouses where demand is highest. This is where inventory management and sell-through optimization intersect directly with returns.
Refurbish and Discount
When refurbishment makes financial sense—minor cosmetic defects, repairable issues—items enter outlet or clearance channels. Quality standards must still protect brand reputation. Typical discounts range 30–70% off original price.
The margin calculation: does the revenue from discounted sale minus refurbishment cost exceed zero? If yes, it beats liquidation or write-off. If not, move to the next disposition.
Donate and Liquidate
Donations provide tax benefits and a positive sustainability story. Recovery rates are low—often pennies on the dollar—but the environmental impact and brand reputation value can be significant.
Liquidation partners buy bulk returns for secondary markets. Volume matters for negotiating reasonable recovery rates. Timeline considerations: liquidation can take weeks, tying up warehouse space.
Write-off and Disposal
Items with no recoverable value—hygiene-compromised beauty products, severely damaged goods, legally mandated destruction—go here. Proper disposal varies by product category: electronics require hazardous waste protocols, cosmetics have regulatory requirements.
Minimizing write-off rates starts upstream: better packaging to prevent damage, tighter quality control, encouraging exchanges over refunds to retain revenue, and reducing avoidable returns through accurate product information.
Building a Returns Policy That Balances Customer Experience and Margin Protection
Your return policy is a conversion tool, a margin lever, and a brand statement—all at once. 76% of consumers consider free returns a key factor in their shopping decisions. A clear returns policy can increase customer loyalty by 76%.
A transparent return policy reduces customer anxiety and sets expectations that reduce frivolous returns. Clear communication of return policies is vital for customer satisfaction. Here's how to build a policy that works for both you and your customers:
- Return window optimization: Shorter windows reduce risk but frustrate customers. Extended return windows during holidays can boost seasonal conversion without dramatically increasing return volume.
- Free returns vs. paid returns: 76% of consumers say free returns influence shopping decisions. But free and easy returns can lead to a loss unless exchanges occur instead of refunds. Many brands now charge a modest fee (~$9) and see return rates drop 12–25% within 60 days with minimal customer churn.
- Restocking fees: Best applied to bulky, heavy, or high-return items. Must be transparent and clearly stated.
- Exchange prioritization: Offer store credit or direct exchanges before defaulting to refunds. Encouraging exchanges over refunds protects revenue—and often improves the post-purchase experience.
- Geographic and channel-specific rules: International returns, marketplace orders, and in-store returns may each warrant different policies based on cost structures.
Providing high-quality product images helps reduce returns. So does accurate sizing information, video content, and user reviews. A transparent return policy reduces returns by setting clear expectations before purchase, not just after—addressing customer expectations before they become return requests.
How 3PLs Handle Returns: Technology and Process Advantages
Outsourcing returns to a 3PL with dedicated returns processing gives brands scale advantages that are hard to replicate in-house.
Dedicated returns processing facilities use specialized workflows and trained teams for standardized condition assessments. Photo documentation and condition reporting systems give clients full visibility into every return—images, condition grades, reason codes—through real-time dashboards.
RTV (Return to Vendor) decisions—sending defective items back to the supplier for credit versus keeping them in merchant inventory—are managed through integrated workflows.
Using regional return hubs can lower freight costs significantly. ShipNetwork's distributed fulfillment network routes returns to the nearest facility, cutting reverse logistics transit time and cost. Integration with client ecommerce systems via APIs means return initiation, package tracking, disposition reporting, and inventory updates flow automatically.
For brands managing returns in-house, the operational costs of dedicated staff, warehouse space, carrier negotiations, and technology stack add up quickly. 3PLs amortize these fixed costs across multiple clients, making the per-return cost lower at scale. This is where managing returns becomes a strategic advantage rather than just a cost center.
Technology and Visibility: WMS Dashboard Essentials
What your returns management system should show you at a glance:
- Real-time returns volume and processing status: How many returns sit at each stage—initiated, in transit, received, inspected, disposition decided
- Disposition breakdown and recovery rates: Percentage returned to stock at full price vs. refurbished vs. liquidated vs. written off
- Return reason analytics: Defect, wrong size, changed mind—broken down by SKU, product category, and sales channel to identify trends
- Processing time metrics: Time from initiation to label, transit duration, receiving to inspection, inspection to disposition—with bottleneck identification
- Cost per return tracking: Aggregate and per-category, with margin impact analysis
Automated systems can streamline returns management processes by flagging exceptions, routing high-value items for manual review, and triggering escalation workflows. Automation can help manage return logistics more efficiently by removing manual handoffs.
Real-time updates on the status of returns can reduce inquiries from both customers and internal teams. AI-driven analytics can analyze returns data for improvements—detecting fraud patterns, predicting return likelihood by SKU, and recommending policy adjustments based on customer behavior.
The best returns management software ties all of this together in a single dashboard. Returns management systems can reduce operational costs and improve customer satisfaction simultaneously by turning data into action.

Returns aren't just a cost center—they're infrastructure. The brands that treat every return as a data point, a retention opportunity, and a margin recovery moment are the ones building future sales on a foundation of trust. Effective ecommerce returns management drives repeat purchases, reduces operational waste, and creates business outcomes that compound quarter over quarter.
Ready to build a returns process that scales? Explore ShipNetwork's Returns Management Services and see how our distributed network, 100% order accuracy guarantee, and real-time visibility tools turn returns into a strategic advantage for your brand.
Returns Management Glossary
- RMA (Return Merchandise Authorization): A formal approval process that generates tracking, provides a return label, and serves as the eligibility gate for customer returns. Return merchandise authorization ensures only qualified items enter the returns pipeline.
- RTV (Return to Vendor): When defective items are returned to the original supplier or manufacturer for credit rather than staying in merchant inventory.
- Reverse logistics: All operations related to products moving backward through the supply chain—returns, recalls, refurbishing, disposal. Broader than returns management alone.
- Disposition: The decision framework applied post-inspection: return to stock, refurbish and discount, liquidate or donate, or write-off and dispose.
- Restock rate: The percentage of returned items that return to full-price sellable inventory. A critical metric for margin recovery.
- Bracketing: When online shoppers order multiple sizes or variants of the same product intending to return most. Common in apparel and footwear.
- Cost stack: The total layered cost of processing a return, including return shipping, labor, restocking, customer service time, and write-downs.
- Win-back campaign: Post-return marketing aimed at converting a returner into a repeat buyer through targeted offers or exchanges.
FAQs
Returns management is a subset of reverse logistics focused on the customer-facing return process—initiation, authorization, refund or exchange. Reverse logistics encompasses the broader end-to-end process including disposition, refurbishment, liquidation, and disposal across the entire supply chain.
Build a cost stack: return shipping + receiving and grading labor + restocking/refurbishment + customer service time + lost margin + write-off cost. Use vertical benchmarks as a starting point, then refine with your own SKU-level data. The goal is understanding whether each return makes financial sense to process or whether returnless refunds are more efficient for low-value items.
When return volume, complexity, or geography make in-house processing disproportionately expensive. For brands handling 5,000+ orders per month, 3PL scale advantages—volume carrier discounts, specialized labor, technology infrastructure—typically outweigh the margin dilution of outsourcing.
Invest upstream. Providing high-quality product images helps reduce returns. Add detailed size charts, video, AR try-on tools, and user reviews. Tight packaging prevents damage in transit. Proactive quality control catches defects before shipment. Brands fixing product page mismatches based on return reason analytics have reduced future returns by 10–25% in under six months. You can improve customer satisfaction and reduce costs simultaneously—these aren't opposing goals.
Apparel: 24–40%. Electronics: 8–20%. Beauty: 1–8%. Home goods: 5–15%. Adjust based on your AOV, product fragility, sizing complexity, and whether bracketing is common in your category.
Clearly state return responsibility in your policy. Offer local drop-offs or localized return centers where possible. Plan for customs forms and VAT refunds. Partner with cross-border return forwarders for global ecommerce returns at scale.
At minimum: RMA portals, carrier tracking, WMS/ERP sync, customer support systems, and returns analytics dashboards. The best returns management software integrates all of these. AI-powered tools for fraud detection and condition grading are becoming standard for online retailers at scale.
Require photo evidence for damage claims. Inspect condition against stated reason. Monitor return behavior per customer account—flag serial returners. Set value thresholds for manual review. Keep policies transparent so legitimate customers aren't penalized. Clear communication during returns builds customer trust and loyalty, even when you deny a fraudulent claim.
.svg)